
Getting true and honest insights from customers is the best way to understand how they think, feel, and act. When you know what customers really experience, you can improve your product and make it easier for people to reach their goals. A key part of this process is journey mapping, which helps you see every step a customer takes—from the first time they hear about your product to the moment they use it and come back again.
Many people struggle to know where to start when gathering customer research. There are many tools and methods, so picking the right ones can feel overwhelming. To help you begin, this guide explains seven simple yet effective research methods for customer journey mapping. These methods will help you collect useful data, truly understand customer behavior, and build better experiences that work for all types of users.
What Is Customer Journey Mapping?
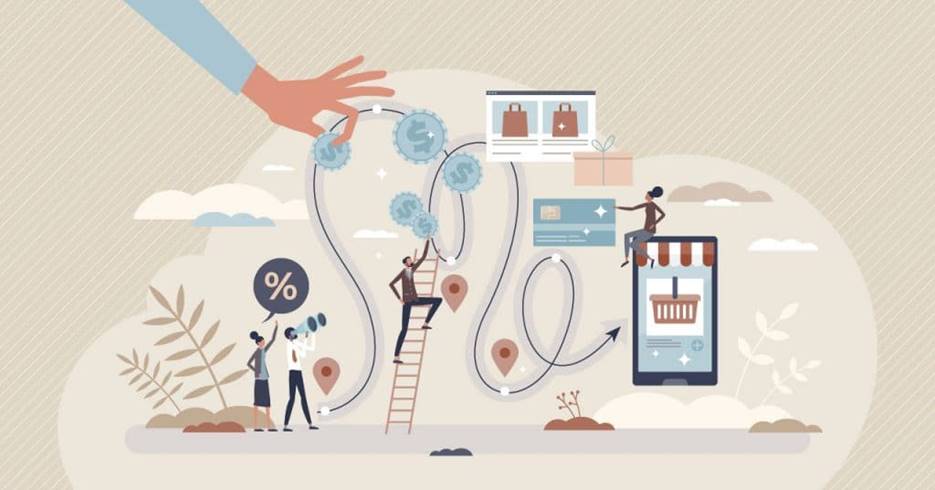
Customer journey mapping is a way to visually show how customers interact with your brand over time. It includes every touchpoint, such as:
- Finding your product online
- Browsing your website
- Testing or trying your product
- Asking questions or seeking help
- Making a purchase
- Returning as a repeat user
A good journey map is not based on assumptions. It is based on real customer behavior, feelings, and needs. To get accurate results, use a mix of both qualitative (human stories and feelings) and quantitative (numbers and data) research.
Qualitative Research Methods
Qualitative research helps you learn the reasons behind customer choices. It reveals what people think, why they do what they do, and how your product fits into their lives.
1. Customer Interviews
Customer interviews are one-on-one talks with real users. These conversations may take place in person or online. Interviews allow you to:
- Hear real stories
- Notice tone, expressions, and reactions
- Discover problems you might not expect
- Build empathy for your users
Start with warm-up questions to make the customer comfortable. Then move into focused questions about their experience, and end with open space for extra comments. After the interview, organize your notes so you can notice patterns and find insights that come up again and again.
2. Remote Observation
Remote observation lets you watch how users interact with your product through online tools. You can see how they move, click, scroll, or get confused. This method helps you understand how people behave in real-life situations without travel or time-intensive setups.
Useful things you can look for:
- Where users click first
- What content catches attention
- Where users stop, go back, or give up
- Where frustration or confusion happens
You can also filter results based on user type, behavior, or location to spot patterns among different groups.
3. Lab Observation
Lab observation means watching a user interact with your product in a controlled space, like a testing room. It takes more time and planning, but it allows close observation and direct conversation.
In a lab, you can:
- Watch body language closely
- Ask questions in real time
- Avoid internet or tech issues
- Build trust and get deeper answers
It’s helpful to record sessions or take notes as things happen so you don’t miss important details.
4. Open-Ended Surveys
Open-ended surveys let users share their thoughts in their own words. They are low-cost and easy to send to many people at once. Use questions that let users answer freely and avoid guiding their choices.
Example of a good question:
- “What caught your attention the most when you visited our homepage?”
Example of what NOT to ask:
- “Did you like our sign-up button on the homepage?”
Let the customer tell you what mattered to them, rather than assuming you already know.
Quantitative Research Methods
Quantitative research gives clear, objective numbers that show user behavior. It helps you track performance and see trends over time.
5. Website Analytics
Website analytics show you what users do on your site, such as:
- Where they came from (search, social media, etc.)
- How long they stayed
- What pages they visited
- When they left or stopped
- Whether they were first-time visitors or returning customers
These metrics help you see what is working and where users are struggling. Combine analytics with qualitative insights to understand both the “what” and the “why.”
6. Quick-Answer Surveys
Quantitative surveys use closed questions with simple answers like “yes/no” or multiple-choice. They are useful when you already have an idea of a problem and want to measure how many people experience it.
Example questions:
- Did you face any issues while browsing? Yes/No
- What was the biggest problem you faced?
This method helps you confirm trends and set priorities.
7. Customer Satisfaction Scores
Measuring satisfaction helps you see how happy users are. One common method is asking how likely a person is to recommend your product on a scale from 0 to 10. This helps sort users into groups:
- Promoters (9–10): Very happy and loyal
- Passives (7–8): Neutral and open to switching
- Detractors (0–6): Unhappy and likely to leave or complain
Ask follow-up questions like:
“What could we do to improve your experience?”
This helps you find the root of problems and fix them faster.
Putting It All Together
To build a strong journey map, you need to combine both feelings (qualitative data) and facts (quantitative data). When you look at customer behavior from different angles, you can:
- Understand real-life challenges
- Remove friction from the experience
- Build trust with users
- Improve products faster
- Increase customer happiness and loyalty
The goal is not just to collect information—it’s to truly know your users so you can create experiences that make their lives better and easier.
Final Thoughts
Strong journey mapping starts with listening to customers and learning from their actions. When you mix clear data with real stories, you get a full picture of your users’ needs. Use these research methods to create better products, offer smoother experiences, and build strong relationships with your customers over time.